| Effect research |
| Empirical downscaling |
| ESD scenarios |
ESD scenarios
Introduction
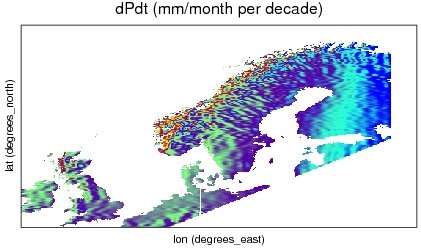
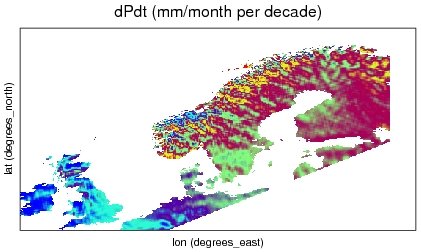
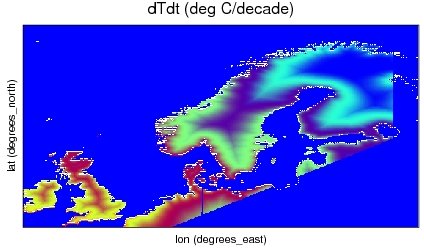
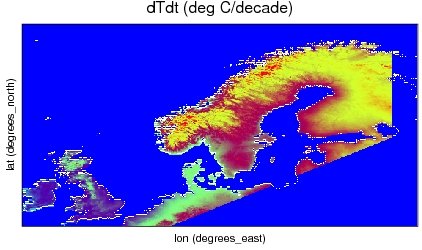
The maps show trends in annual mean temperature and precipitation, derived from many
different global climate model simulations carried out for the next IPCC report
(Assessment Report 4). The simulations used here follow the SRES A1b emission scenario.
The empirical downscaling has been carried out for single locations, but a geographical
regression model has been used for spatial interpolation, together with a Kriging analysis
for the residuals.
(see 'Auxiliary material' at 'ftp://ftp.agu.org/apend/gl/2005GL023401' for more information).
The empirical downscaling employed a quality control through the identification of similar
spatial structure in the observed and modelled temperature and precipitation, and weighted
mean values, inspired by Bayesian approaches, were used to produce these gridded data.
The analysis is described in further detail in Benestad (2005a,b) and references therein.
The maps showing an analysis for extreme precipitation (percentiles) are partly based on the results above and partly on statistical relationship betwee the distribution of 24-hour (wet-day) precipitation ('probability density function', 'pdf') and the mean local temperature and precipitation (similar analysis was performed for the number of wet days), as well as geographical parametres. This analysis is described in more detail in Benestad, R.E. (2006).
Datasets
The files presented here are netCDF (http://ftp.unidata.ucar.edu/software/netcdf/) files containing the results of Empirical-Statistical Downscaling that have been gridded for Northern Europe:
- Europe_E-SDS_DailyPrecipDistrParam.nc - gridded quantiles, frequencies and distribution parametres for 24-hr precipitation. Ref: Benestad, R.E. (2006)
- Europe_E-SDS_precip-trend_map.nc - gridded ESD trends for annual mean precipitation. Ref: Benestad, R.E. (2005a)
- Europe_E-SDS_t2m-trend_map.nc - gridded ESD trends for annual mean temperature. Ref: Benestad, R.E. (2005a)
- Europe_E-SDS_precip-mean_map.nc - gridded annual mean precipitation for present climate. Ref: Benestad, R.E. (2005a)
- Europe_E-SDS_t2m-mean_map.nc - gridded annual mean temperature for present climate. Ref: Benestad, R.E. (2005a)
Sample plots:


References
- Benestad, R.E. (2005a) Climate change scenarios for northern Europe
from multi-model IPCC AR4 climate simulations GRL,32
doi:10.1029/2005GL023401 No. 17, L17704
http://www.agu.org/pubs/crossref/2005/2005GL023401.shtml
ftp://ftp.agu.org/apend/gl/2005GL023401. - Benestad, R.E. (2005b) 'Nye nedskalerte scenarier' Cicerone,nr.
5/2005, s. 28-29.
http://www.cicero.uio.no/cicerone/05/5/cicerone05-05.pdf - Benestad, R.E. (2006) Future Changes in Extreme Rainfall over Northern
Europe, RecClim General Technical Report No. 9, p. 145-158.
http://regclim.met.no/results/gtr9.pdf - Benestad, R.E. Methodological details regarding the E-SD and mapping the results
NetCDF extract
A brief explanation of the netCDF-files content:
netcdf Europe_E-SDS_DailyPrecipDistrParam {
dimensions:
        lon = 540 ;
        lat = 276 ;
variables:
        double lon(lon) ;
                lon:units = "degrees_east" ;
        double lat(lat) ;
                lat:units = "degrees_north" ;
        float q95(lat, lon) ;                            - Present day
                q95:units = "mm/day" ;
                q95:missing_value = -999.f ;
                q95:scale_factor = 0.01 ;
        float q95x(lat, lon) ;                           - Projection for 2050
                q95x:units = "mm/day" ;
                q95x:missing_value = -999.f ;
                q95x:scale_factor = 0.01 ;
        float q95Error(lat, lon) ;
                q95Error:units = "mm/day" ;
                q95Error:missing_value = -999.f ;
                q95Error:scale_factor = 0.01 ;
        float q95xError(lat, lon) ;
                q95xError:units = "mm/day" ;
                q95xError:missing_value = -999.f ;
                q95xError:scale_factor = 0.01 ;
        float slope(lat, lon) ;                           - slope parameter 'm' for present day
                slope:units = "mm/day" ;
                slope:missing_value = -999.f ;
                slope:scale_factor = 0.01 ;
        float slopeX(lat, lon) ;                          - slope parameter 'm' for 2050
                slopeX:units = "mm/day" ;
                slopeX:missing_value = -999.f ;
                slopeX:scale_factor = 0.01 ;
        float slopeError(lat, lon) ;
                slopeError:units = "mm/day" ;
                slopeError:missing_value = -999.f ;
                slopeError:scale_factor = 0.01 ;
        float N(lat, lon) ;                               -  Number of wet days per year for present day
                N:units = "days/year" ;
                N:missing_value = -999.f ;
                N:scale_factor = 0.01 ;
        float Nx(lat, lon) ;                              -  Number of wet days per year for 2005
                Nx:units = "days/year" ;
                Nx:missing_value = -999.f ;
                Nx:scale_factor = 0.01 ;
        float Pr95(lat, lon) ;                            -  Pr(P > q95[present]) for 2005
                Pr95:units = "%" ;
                Pr95:missing_value = -999.f ;
                Pr95:scale_factor = 0.01 ;
        float q95_glm(lat, lon) ;                          - Present day, based on GLM
                q95_glm:units = "%" ;
                q95_glm:missing_value = -999.f ;
                q95_glm:scale_factor = 0.01 ;
        float q95x_glm(lat, lon) ;                         - Projection for 2050, based on GLM
                q95x_glm:units = "%" ;
                q95x_glm:missing_value = -999.f ;
                q95x_glm:scale_factor = 0.01 ;
        float Pr95_glm(lat, lon) ;                         -  Pr(P > q95[present]) for 2005, based on GLM
                Pr95_glm:units = "%" ;
                Pr95_glm:missing_value = -999.f ;
                Pr95_glm:scale_factor = 0.01 ;


netcdf Europe_E-SDS_t2m-mean_map {
dimensions:
        lon = 540 ;
        lat = 276 ;
variables:
        double lon(lon) ;
                lon:units = "degrees_east" ;
        double lat(lat) ;
                lat:units = "degrees_north" ;
        float dTdt(lat, lon) ;                            - Name and unit should be "T2m" and "deg C"
                dTdt:units = "deg C/decade" ;
                dTdt:missing_value = -999.f ;
                dTdt:scale_factor = 0.01 ;
Send comments to webmaster