Results for 2021
Go to results for 2020Go to results for 2019
Go to results for 2018
Go to results for 2017
Go to results for 2016
Go to results for 2015
Go to results for 2014
Go to results for 2013
Go to results for 2012
Sea ice concentration vs. ice chart data
Ice chart definitions
Timeseries
| Quarter 1 | Quarter 2 | Quarter 3 | Quarter 4 |
| Week 1 | Week 7 |
| Week 2 | Week 8 |
| Week 3 | Week 9 |
| Week 4 | Week 10 |
| Week 5 | Week 11 |
| Week 6 |
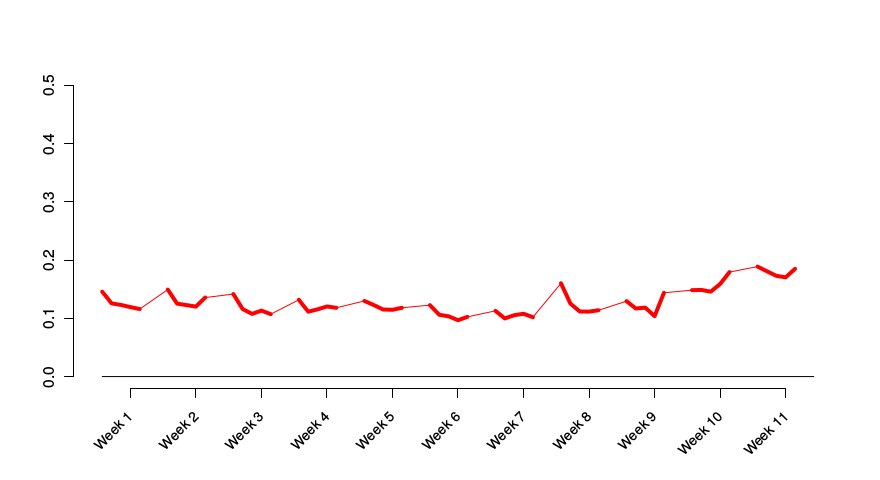
Sea ice concentration, root-mean-square difference, Nordic 4km
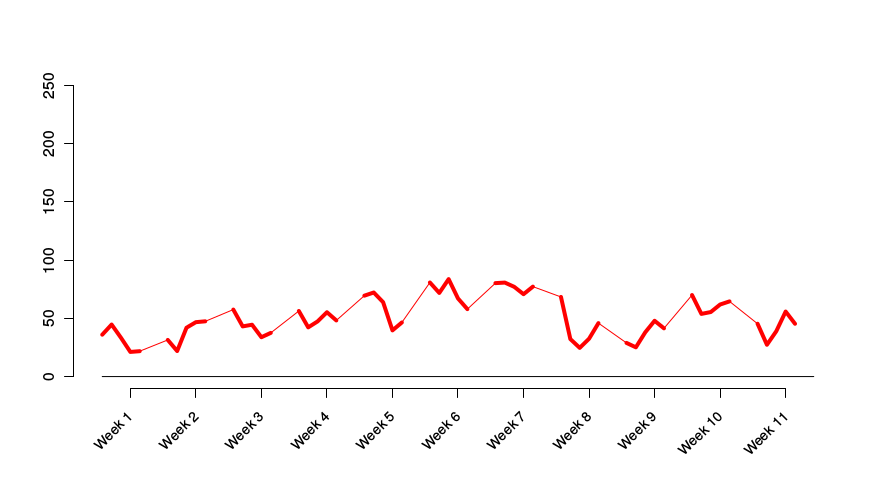
Ice edge position, root-mean-square difference, Nordic 4km
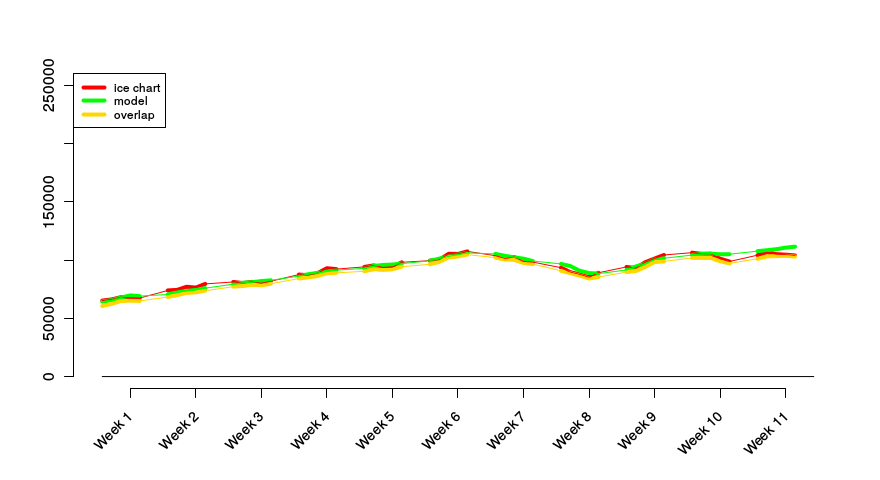
Sea ice extent (no. grids), Nordic 4km
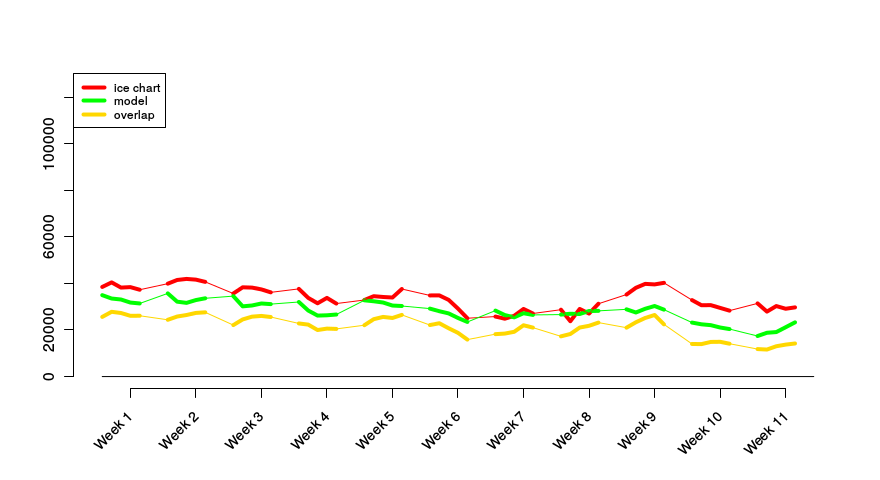
Extent, marginal ice zone (no. grids), Nordic 4km
Sea ice concentration, root-mean-square difference, Arctic 20km

Ice edge position, root-mean-square difference, Arctic 20km

Sea ice extent (no. grids), Arctic 20km

Extent, marginal ice zone (no. grids), Arctic 20km
