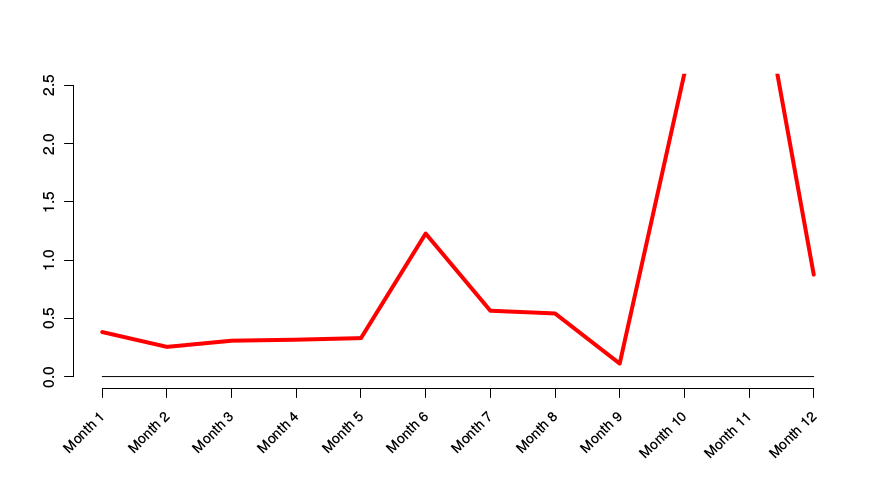
Results for 2020, layer 2
| Layer 1 | Layer 2 | Layer 3 | Layer 4 |Go to results for 2019, layer 2
Go to results for 2018, layer 2
Go to results for 2017, layer 2
Go to results for 2016, layer 2
Go to results for 2015, layer 2
Go to results for 2014, layer 2
Go to results for 2013, layer 2
Go to results for 2012, layer 2
T,S profiles vs. cruise data
Timeseries
NorKyst 800m:
No. observations |
Bias |
RMS
| Quarter 1 | Quarter 2 | Quarter 3 | Quarter 4 |
| Month 1 | Month 4 | Month 7 | Month 10 |
| Month 2 | Month 5 | Month 8 | Month 11 |
| Month 3 | Month 6 | Month 9 | Month 12 |
No. observations, NorKyst 800m
No. T profiles, NorKyst 800m
| Layer 1 | Layer 2 | Layer 3 | Layer 4 |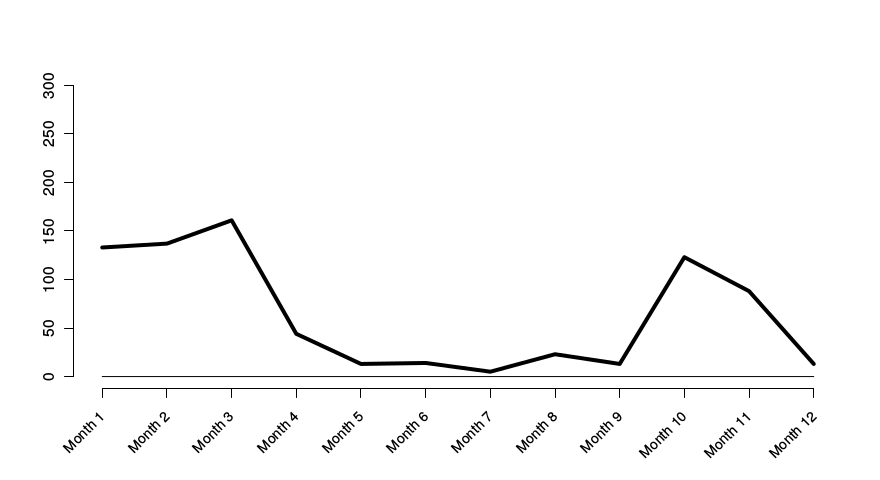
No. S profiles, NorKyst 800m
| Layer 1 | Layer 2 | Layer 3 | Layer 4 |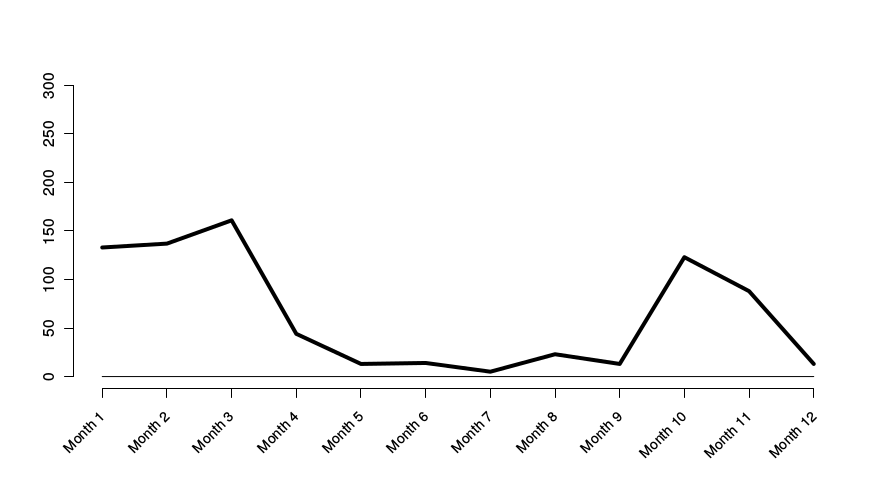
Bias (model-observation), NorKyst 800m
T profile bias, NorKyst 800m
| Layer 1 | Layer 2 | Layer 3 | Layer 4 |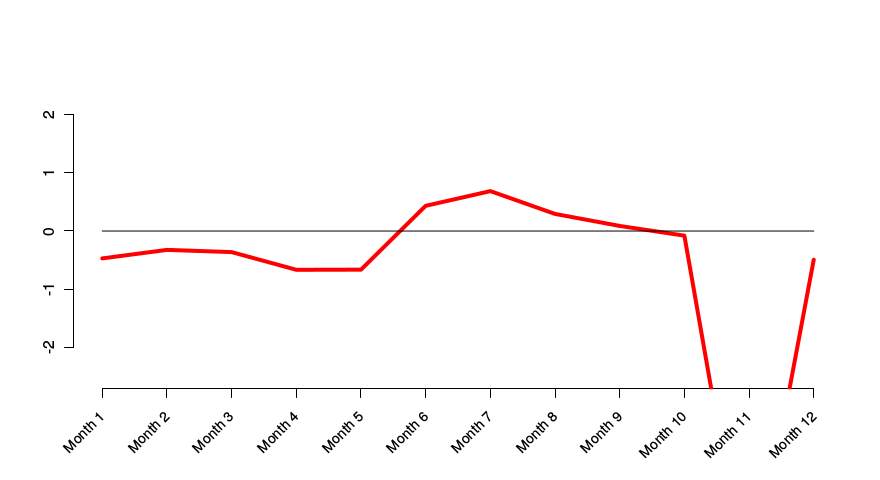
S profile bias, NorKyst 800m
| Layer 1 | Layer 2 | Layer 3 | Layer 4 |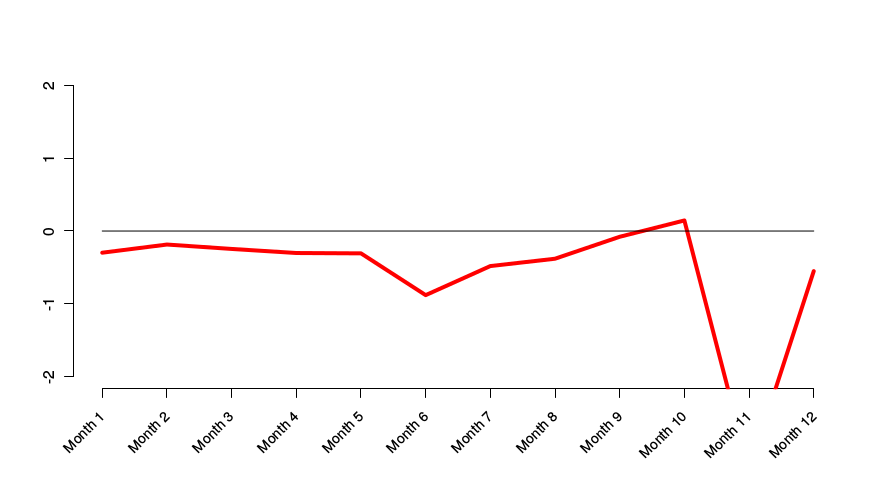
Root-mean-square difference, NorKyst 800m
T profile RMS, NorKyst 800m
| Layer 1 | Layer 2 | Layer 3 | Layer 4 |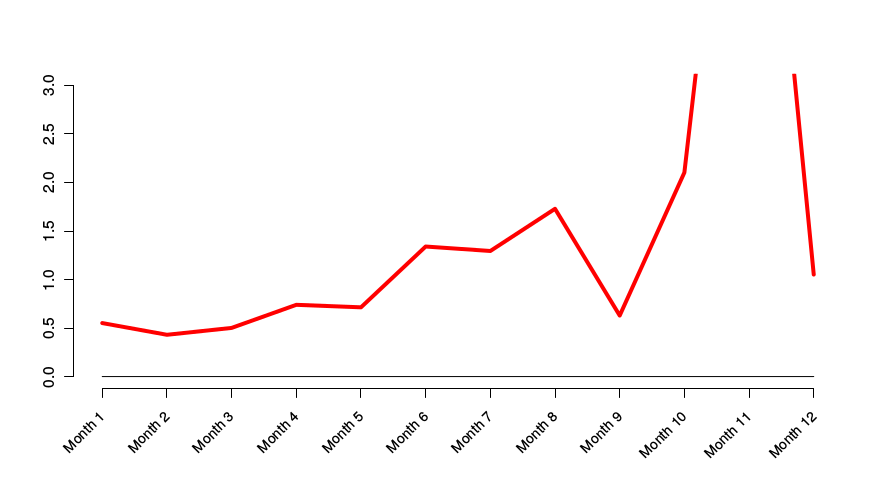
S profile RMS, NorKyst 800m
| Layer 1 | Layer 2 | Layer 3 | Layer 4 |